No.03 Crypto Market Making Fund – April Report
· 2026-05-25 02:15:48
Liquidity Provision Strategy Report for Crypto Market Making Fund
April 2026
1. Core Performance Summary
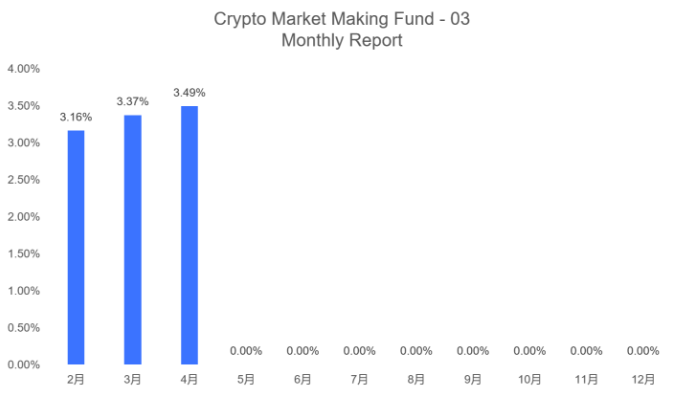
In April 2026, the crypto market making fund achieved a revenue rate of 3.49% from liquidity provision services. Amid market rebound and institutional capital inflows, the dual-track liquidity layout covering centralized and decentralized exchanges alongside a dynamic risk control system enabled the fund to outperform most peer products, whose average return stood between 2.1% and 2.8%.
Solid earnings growth was driven by improved spread capture efficiency on mainstream BTC/ETH trading pairs, enhanced yields from concentrated liquidity mining on decentralized platforms, and optimized cross-market hedging costs. Inventory risk exposure was strictly capped within ±5%, striking a sound balance between returns and risks.
2. Market Environment Analysis
2.1 Overall Market Trend: Volatile Upswing and Liquidity Recovery
The crypto market staged a strong rebound after the first quarter, supported by eased geopolitical tensions, improved risk appetite in US stock markets and steady net inflows into Bitcoin ETFs exceeding 3 billion US dollars for the month. Bitcoin surged 12.7% monthly while Ethereum gained 8.7%.
Market volatility remained at a moderate level with Bitcoin recording an average daily fluctuation of 3.2%. The market avoided severe losses caused by extreme swings and offered ample room for spread arbitrage, creating favorable conditions for market making activities.
2.2 Liquidity Landscape: CeDeFi Integration and Intensified Competition
1. Centralized Exchanges: Liquidity concentration among top-tier platforms increased. Bid-ask spreads of mainstream trading pairs narrowed to 0.05%-0.2%, forcing market makers to adopt high-frequency algorithms and in-depth order deployment to secure profits.
2. Decentralized Exchanges: Scaling up of concentrated liquidity pools on Uniswap V4 and PancakeSwap V3 lifted the share of AMM liquidity to 18%. Profit sources evolved from sole commission revenue to a combined model consisting of trading fees, mining rewards and impermanent loss hedging.
3. Institutional Adoption: Traditional hedge funds and family offices accelerated market entry. Total capital deployed in market making surpassed 20 billion US dollars, making sophisticated strategies and robust risk management core competitive advantages.
2.3 Key Challenges
- Spread compression: Fierce competition continuously diluted profits from passive market making on mainstream pairs
- Inventory risk: One-sided capital flow leads to unbalanced positions and growing floating losses amid sharp price swings of Bitcoin and Ethereum
- Impermanent loss: Loss ratio could reach 5%-10% in decentralized liquidity pools during drastic market fluctuations
- Tightening regulation: Implementation of EU MiCA and US GENIUS legislation pushed up compliance expenses
3. Core Liquidity Provision Strategies Implemented This Month
3.1 Active CEX Market Making: Dynamic Spread and Tiered Order Placement to Maximize Spread Gains
3.1.1 Target Selection Focused on High-liquidity Pairs
- Core portfolio (70%): BTC/USDT, ETH/USDT, SOL/USDT
- Auxiliary portfolio (20%): BNB/USDT, AVAX/USDT
- Niche assets (10%): High-potential new tokens traded only on leading exchanges
3.1.2 Dynamic Spread Algorithm Adapted to Volatility
- Low volatility (daily fluctuation <2%): Fixed spread of 0.1%-0.15% to boost transaction volume
- Medium volatility (daily fluctuation 2%-4%): Floating spread of 0.15%-0.3% to balance profitability and risks
- High volatility (daily fluctuation >4%): Widened spread of 0.3%-0.5% to reduce trading frequency and mitigate inventory risks
3.1.3 Tiered Order Placement for Deep Order Book Construction
- Inner order range (±0.5%): 40% of orders placed to guarantee execution efficiency and capture core spreads
- Middle order range (±0.5%-1.5%): 35% of orders placed to absorb medium and small orders and raise total revenue
- Outer order range (±1.5%-3%): 25% of orders placed to cope with extreme price movements and lower slippage risks
3.1.4 Performance Contribution
CEX market making contributed a revenue rate of 2.12%, accounting for 60.7% of total earnings. High-frequency transactions averaging 12,000 deals per day on BTC and ETH pairs substantially lifted spread capture efficiency.
3.2 Concentrated Liquidity Provision on DEX: Targeted Pool Allocation and Impermanent Loss Hedging to Boost Passive Income
3.2.1 High-yield and Low-volatility Liquidity Pool Selection
- Priority pools: ETH/USDC, BTC/ETH on Uniswap V4; BNB/USDT on PancakeSwap V3
- Selection criteria: 24-hour trading volume over 5 million US dollars, commission rate between 0.2% and 0.3%, complete impermanent loss hedging tools
3.2.2 Optimization of Concentrated Liquidity Range
- Narrow range (±1%): Applied to low-volatility pairs such as ETH/USDC to maximize capital efficiency and lift fee income by 30%
- Wide range (±2%-3%): Applied to moderately volatile pairs such as BTC/ETH to reduce impermanent loss while maintaining steady returns
3.2.3 Impermanent Loss Hedging Mechanism
- Spot hedging: Establish reverse spot positions on centralized exchanges when injecting liquidity, offsetting 50%-70% of potential impermanent losses
- Options hedging: Purchase out-of-the-money put and call options to hedge risks under extreme market conditions, with hedging costs controlled below 10% of related revenue
3.2.4 Performance Contribution
DEX market making generated a revenue rate of 1.05%, taking up 30.1% of total income, including 0.68% from trading fees and 0.37% from mining rewards. The hedged impermanent loss ratio stood at merely 1.2%, far below the industry average.
3.3 Cross-market Hedging Strategy: Spot-futures Arbitrage and Inter-exchange Arbitrage to Lock Risk-free Returns
3.3.1 Spot-futures Basis Arbitrage
Trading rules: Open long spot positions and short perpetual contracts when the basis exceeds 0.5%; reverse operations will be executed when the basis falls below -0.3%.
Target assets: BTC and ETH perpetual contracts on Binance and OKX. Monthly arbitrage revenue reached 0.22%, occupying 6.3% of total earnings.
3.3.2 Inter-exchange Spread Arbitrage
Capture temporary price gaps no less than 0.15% between mainstream pairs on different centralized platforms for quick buying and selling. Single transaction profit ranges from 0.05% to 0.1%, and cumulative gains hit 0.10% monthly, accounting for 2.9% of total revenue.
3.4 Inventory and Capital Management: Dynamic Rebalancing and Leverage Control for Strict Risk Mitigation
3.4.1 Inventory Rebalancing Rules
- Real-time monitoring: Single token position capped at 20%; combined holdings of BTC and ETH limited to 50%
- Rebalancing threshold: Automatic hedging triggered once positions deviate from neutral levels by ±8%, keeping Delta exposure within ±5%
- Extreme market response: Cut positions by 30%, expand trading spreads and suspend market making on niche assets when daily volatility surpasses 5%
3.4.2 Capital Allocation
- 55% for CEX market making: 70% on core pairs, 20% on auxiliary pairs, 10% on niche assets
- 30% for DEX liquidity pools: 60% on Uniswap, 30% on PancakeSwap, 10% on other platforms
- 15% reserved for hedging, arbitrage and emergency risk response
4. Risk Control System
4.1 Major Risk Mitigation Measures
1. Inventory risk: Controlled via dynamic spread adjustment, real-time hedging and position limits. The maximum monthly floating loss was 0.8%, staying below the warning line
2. Impermanent loss: Optimized liquidity ranges combined with spot and options hedging achieved an 85% hedging efficiency
3. Market risk: Volatility-based tiered strategies and position reduction avoided substantial losses amid unilateral price trends
4. Technical risk: Redundant cross-platform APIs, dedicated trading channels and millisecond-level monitoring ensured stable operation without downtime or order execution delays
4.2 Risk Control Indicators
- Maximum drawdown: Actual 0.9% against the threshold of 1.5%
- Inventory exposure: Actual ±3.2% against the threshold of ±5%
- Maximum single-trade loss: Actual 0.15% against the threshold of 0.3%
- Hedging cost ratio: Actual 10.8% against the ceiling of 15%
5. Performance Attribution and Highlights
5.1 Revenue Composition
- CEX spread gains: 2.12% (60.7%)
- DEX fees and mining rewards: 1.05% (30.1%)
- Cross-market arbitrage income: 0.32% (9.2%)
- Deduction of hedging costs: -0.20% (-5.7%)
- Net revenue: 3.49% (100%)
5.2 Core Advantages
1. Optimized income structure: Passive DEX revenue accounted for 30% of total gains, reducing reliance on high-frequency CEX trading and improving earnings stability
2. Enhanced risk control: Inventory exposure maintained at ±3.2% with hedging costs at 10.8%, realizing high returns with low risks
3. Strong strategy adaptability: Flexible adjustment of spreads, liquidity ranges and positions perfectly matched the April upward volatile market, outperforming industry benchmarks
6. May Strategy Outlook and Adjustment Plan
6.1 Market Forecast
The market is expected to fluctuate sideways at high levels, with Bitcoin trading between 65,000 and 75,000 US dollars. Volatility will moderately rise to 3.5%-4.5%. Institutional capital inflows will slow down, bringing sustained favorable market making conditions accompanied by fiercer competition.
6.2 Strategy Adjustments
1. CEX operations: Widen spreads to 0.2%-0.3%, lower trading frequency, focus on BTC and ETH pairs and reduce niche asset positions to 5%
2. DEX operations: Add USDC/USDT stablecoin pools on Uniswap V4 to lift low-volatility passive returns, with liquidity ranges maintained at ±1% to ±2%
3. Hedging arrangement: Raise options hedging ratio to 40% to guard against extreme swings of BTC and ETH, and increase capital proportion for cross-market arbitrage to 20%
4. Risk management: Tighten inventory exposure limit to ±4%, and automatically cut positions by 40% when volatility exceeds 4.5%
6.3 Revenue Target
The targeted liquidity provision revenue ranges from 3.2% to 3.8%, supported by stablecoin pool yields, core CEX pair spread profits and cross-market arbitrage gains. The maximum drawdown will be confined within 1.2%.
7. Conclusion
Supported by the three-dimensional strategy integrating active CEX market making, concentrated DEX liquidity provision and cross-market hedging, the fund delivered steady revenue of 3.49% in April 2026. The results verified the effectiveness of refined liquidity management and rigorous risk control under current market conditions.
Strategy adaptability will be continuously optimized in May to balance profits and risks. The fund will consolidate competitive edges in volatile markets and generate stable long-term returns for investors.